warning, this post is geeky, if you don’t get any kicks from math equations and modelling, you might want to take a break this time.
it’s your friend who studied math or physics you need to go to, when it’s time to solve one of these difficult problem that life imposes on you. well sometimes it might be your shrink as well… anyway here it’s a model that’s needed, a systematical approach that provides some sense in this universe of coincidences.
antti, a friend at work, he’s such a bloke, called him last sunday and asked him for help with figuring out a good approximation of how progress in this marathon preparation could be modelled. a couple of days later we sat down to crack this nut.
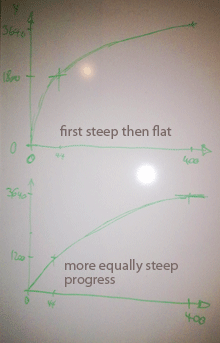
the first thing that became clear is that a natural function, i.e. e^x or its inverse ln(x) seem most reasonable, because most natural processes progress this way. since running improvements don’t happen exponantially - the incremental improvements tend to become smaller the better you are - we picked the ln(x) function.
 we knew that the x-axis is the time, i.e. the 400 days, from 0 to 400. the y-axis is the time of of improvement in seconds from an assumed marathon time at day 0, here 3:30h . at day 0 there’s zero seconds of improvement, at day 400 we need to go below 2:30h, which means an improvement of a bit more than one hour or 3600 seconds, 3640 seconds were used. what was totally unclear is where on the ln(x) function we would be. in the beginning, where at first the slope is very steep and hence the time improvements come in very quickly after only a couple of weeks of training, but the improvements flatten and in the last 100 days there’s only improvements of a couple of minutes. or are we more towards the end of the ln(x) function where improvements come in more equally distributed through the whole time of 400 days?
antti therefore suggested an equation that would let us figure this out mathematically. very elegant thing this system of equations.
y =a * ln(x+b) + c
with three variables a, b and c we needed three data points to get the equation ready to roll. with day 0 and day 400 assumptions, 3:30h (= 0 seconds improvement) and sub-2:30h (=3640 seconds improvement) respectively, we had two already. the third came from a yasso 800s training on around day 40. with some “management adjustment” - out of the approximately 3:00h became 3:10h. now we had three equations and could calculate the three variables a, b and c. we spare you the actual values, calculated to the fourth decimal. the final result, the progress curve is on the progress page.
finally there’s sense in gathering data points every now and then. the 10k’s start in november and will provide good first indications.
Tags: progress


Leave a Reply
You must be logged in to post a comment.