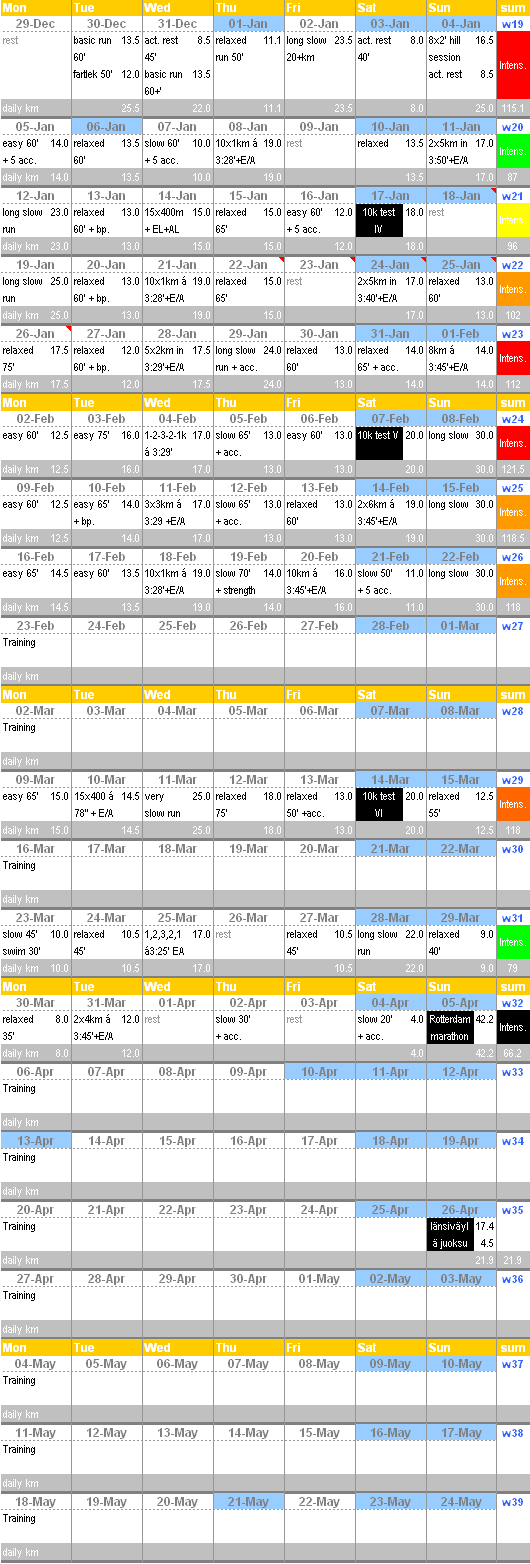
for an overview of the different training phases see the masterplan. Here the training program in detail from jan 2009 onwards.
The daily km is summed up to a weekly amount in the grey lines. the weekly intensity is represented by a green, yellow, orange or red tag on the right. intensity is a measure based on the weekly km amount, the intesity of the individual daily sessions and the expected fitness state for the respective week. the run classifications are average heart rate based: slow = 130 - 145bpm, easy = 145 - 155bpm, relaxed = 155 - 165bpm.
January ‘09 to April ‘09 below
May ‘09 to June ‘09 including the bike tour
July ‘09 to September ‘09 until the Berlin Marathon
November ‘09 to January ‘10, the 10km winter period


Leave a Reply
You must be logged in to post a comment.